Making Health Data Feel Human.
A playful data experience that turns calories, activity, and nutrition into everyday insight
Scope
Duration
Year

/
Challenge
Health data was available - but not motivating or understandable
Most health and fitness applications provide large amounts of data, yet fail to translate it into insights people can actually understand or act on. Calories burned, activity types, and eating behavior were often displayed as abstract numbers or dense charts, disconnected from daily routines and emotional engagement.
Users struggled to recognize patterns over time, compare activities meaningfully, or feel motivated by their own progress. The core problem was not a lack of data — it was a lack of clarity, context, and emotional resonance.
/
Experience
Turning complex data into playful, intuitive stories.
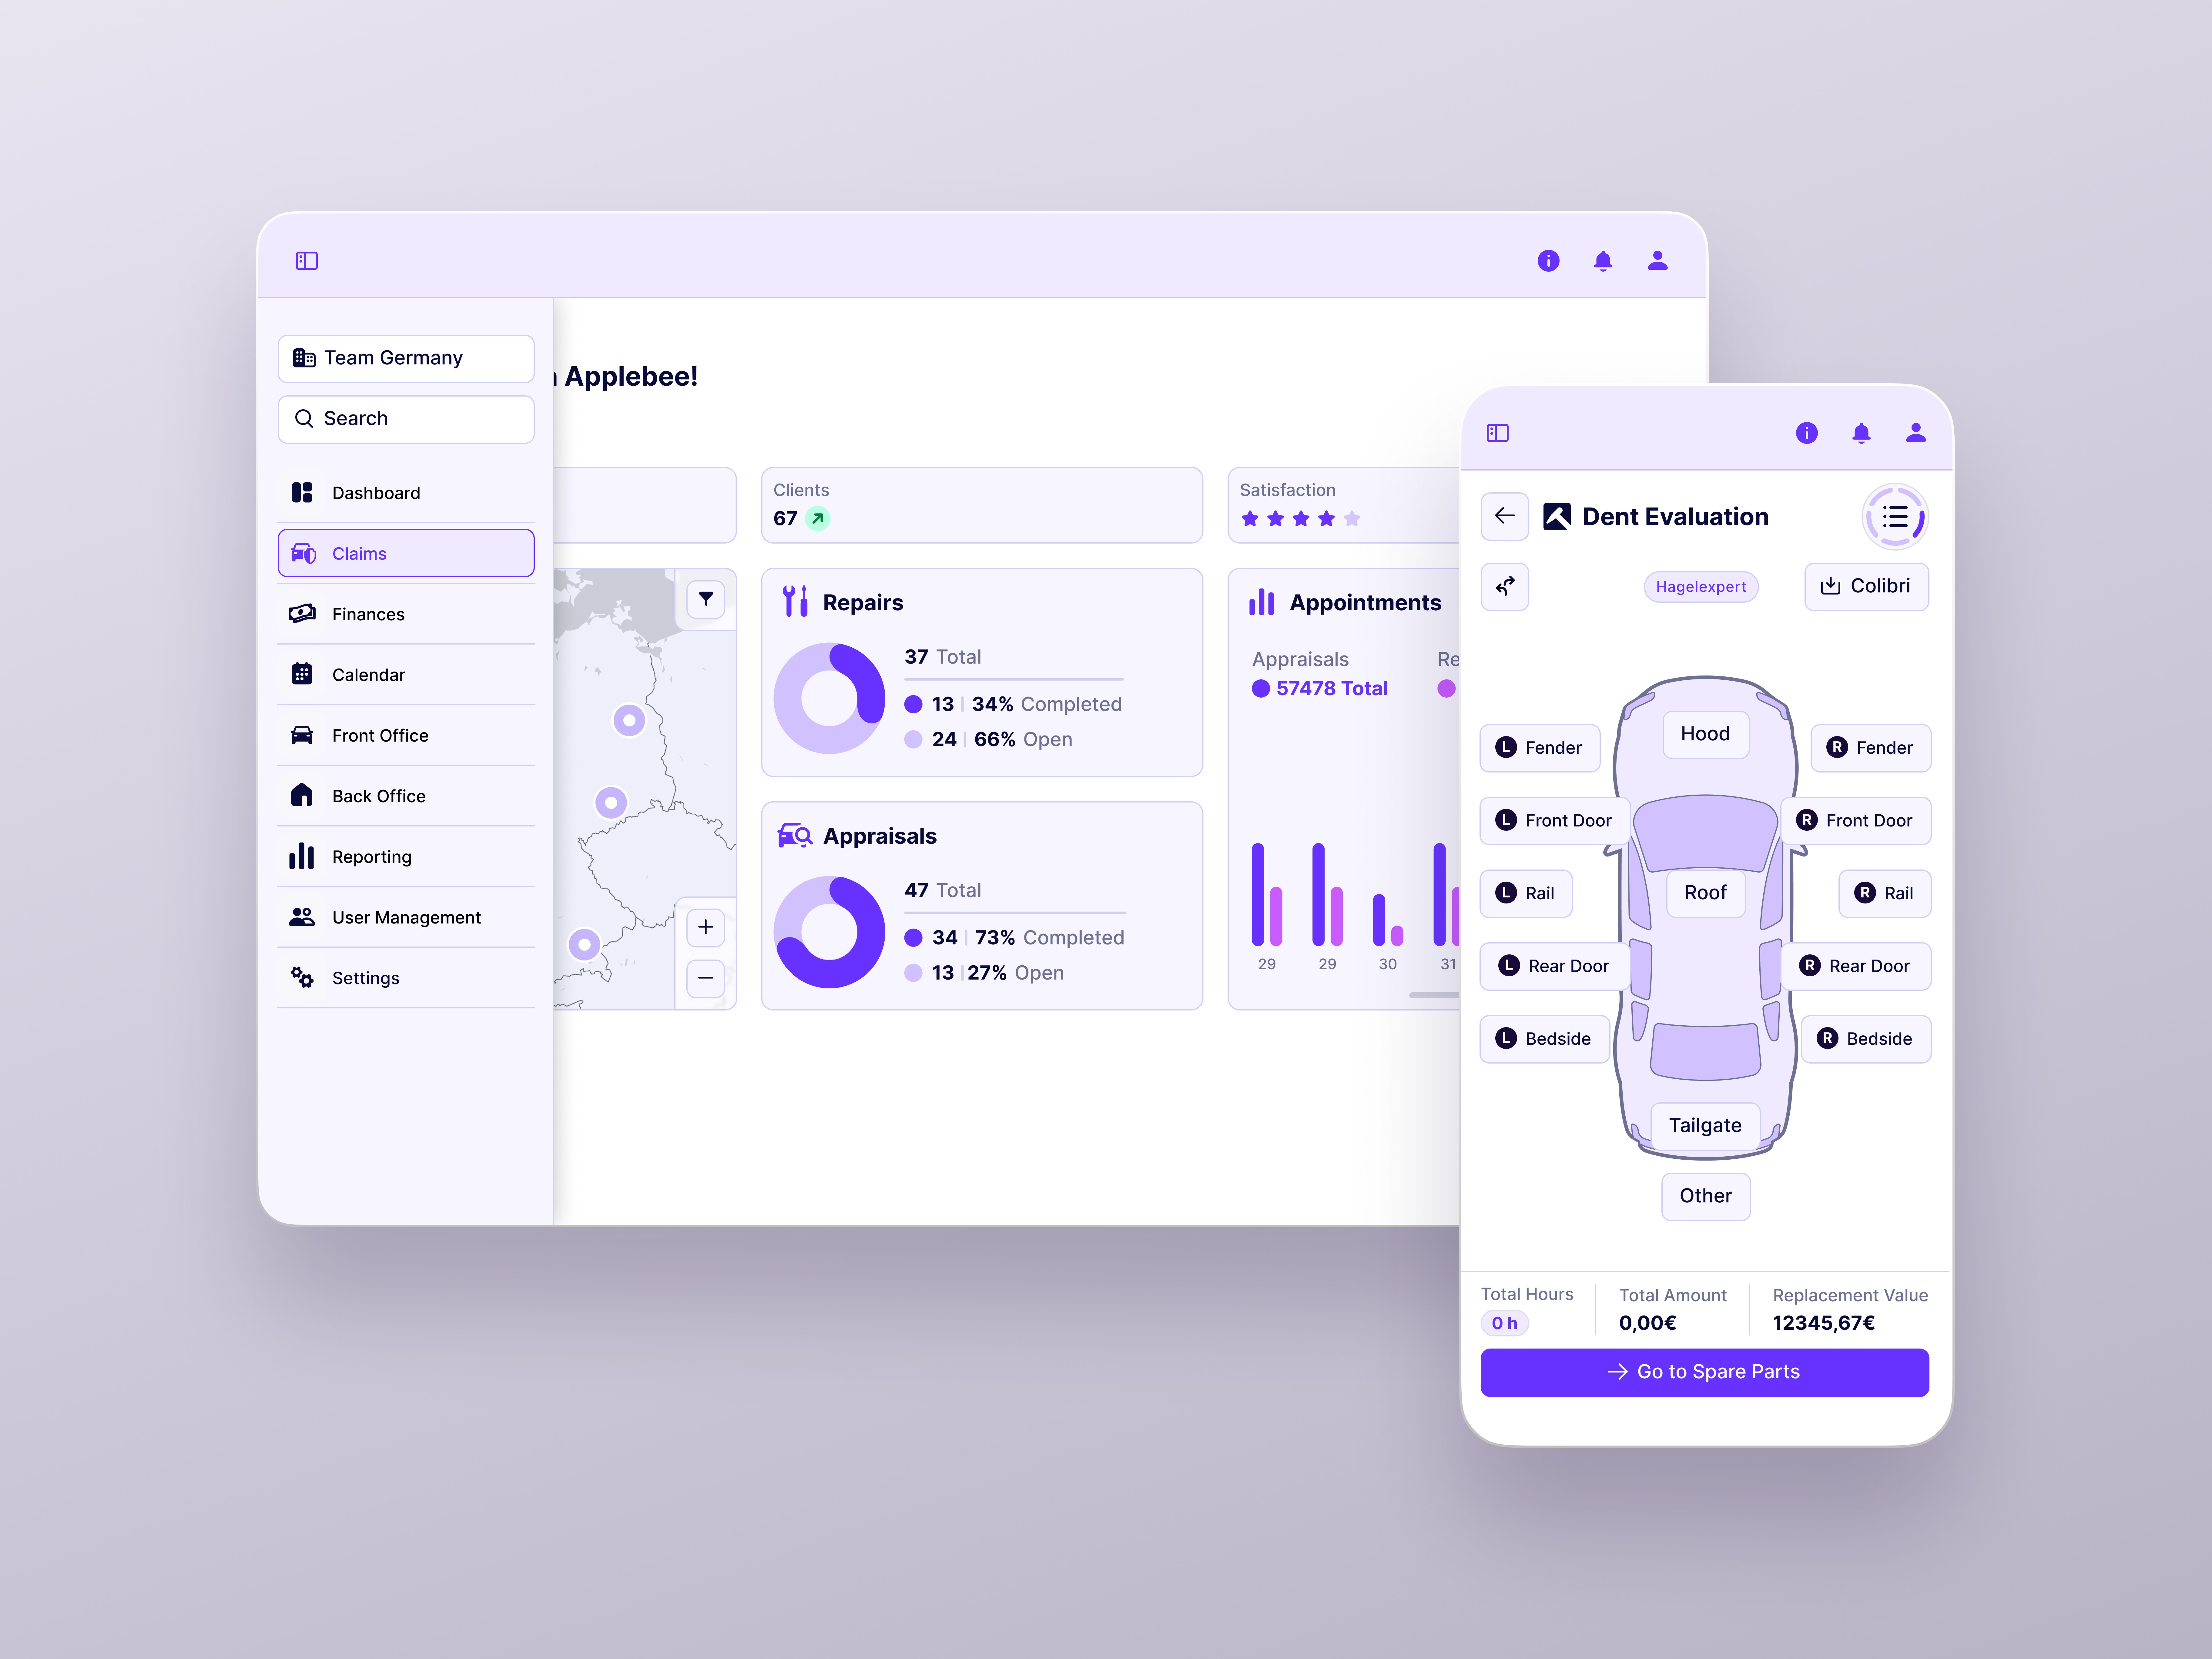
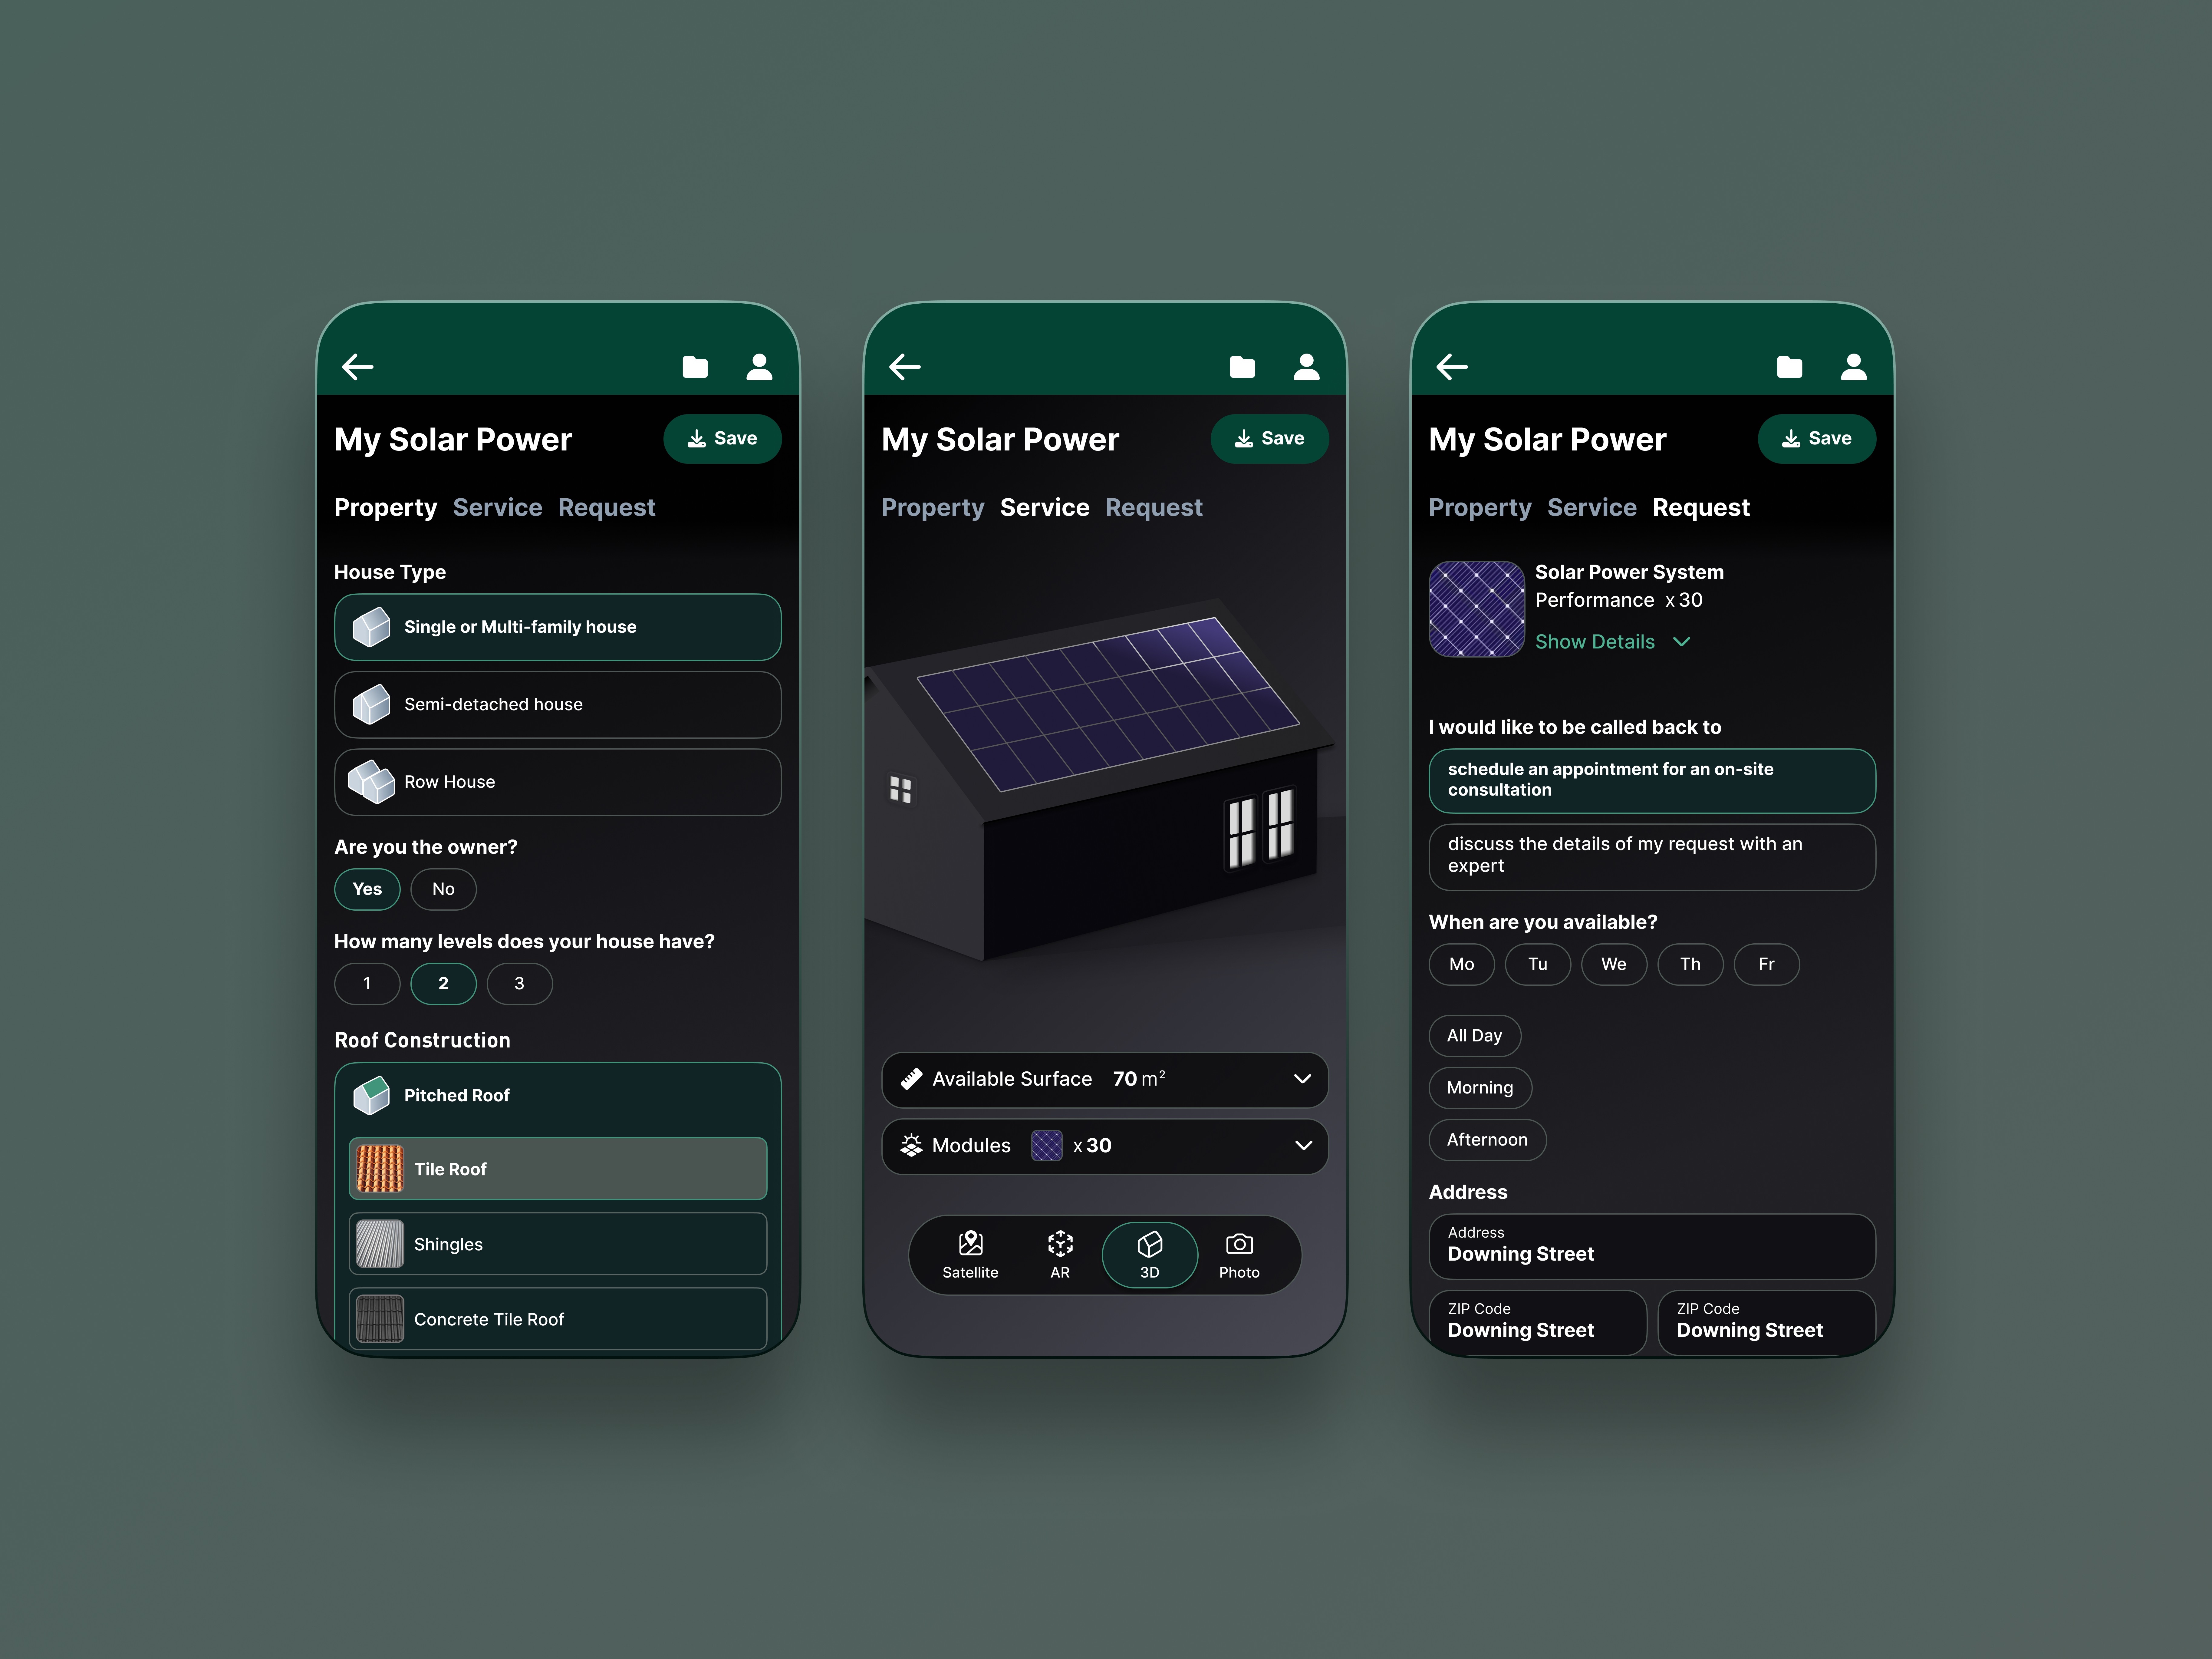
I designed a visual-first experience that transforms health metrics into approachable, game-like representations. Instead of overwhelming users with raw numbers, the interface emphasizes trends, comparisons, and relative impact over time.
Calories burned are visualized through dynamic shapes and proportions, activity types become instantly comparable, and monthly or yearly views reveal patterns at a glance. By combining soft visuals, clear hierarchy, and familiar interaction patterns, the product encourages exploration rather than obligation.
The result is an experience where users don’t just track their behavior - they understand it, reflect on it, and feel motivated to continue.
Latest Projects.
A curated selection of projects that reflect our commitment to simplicity and purposeful design.